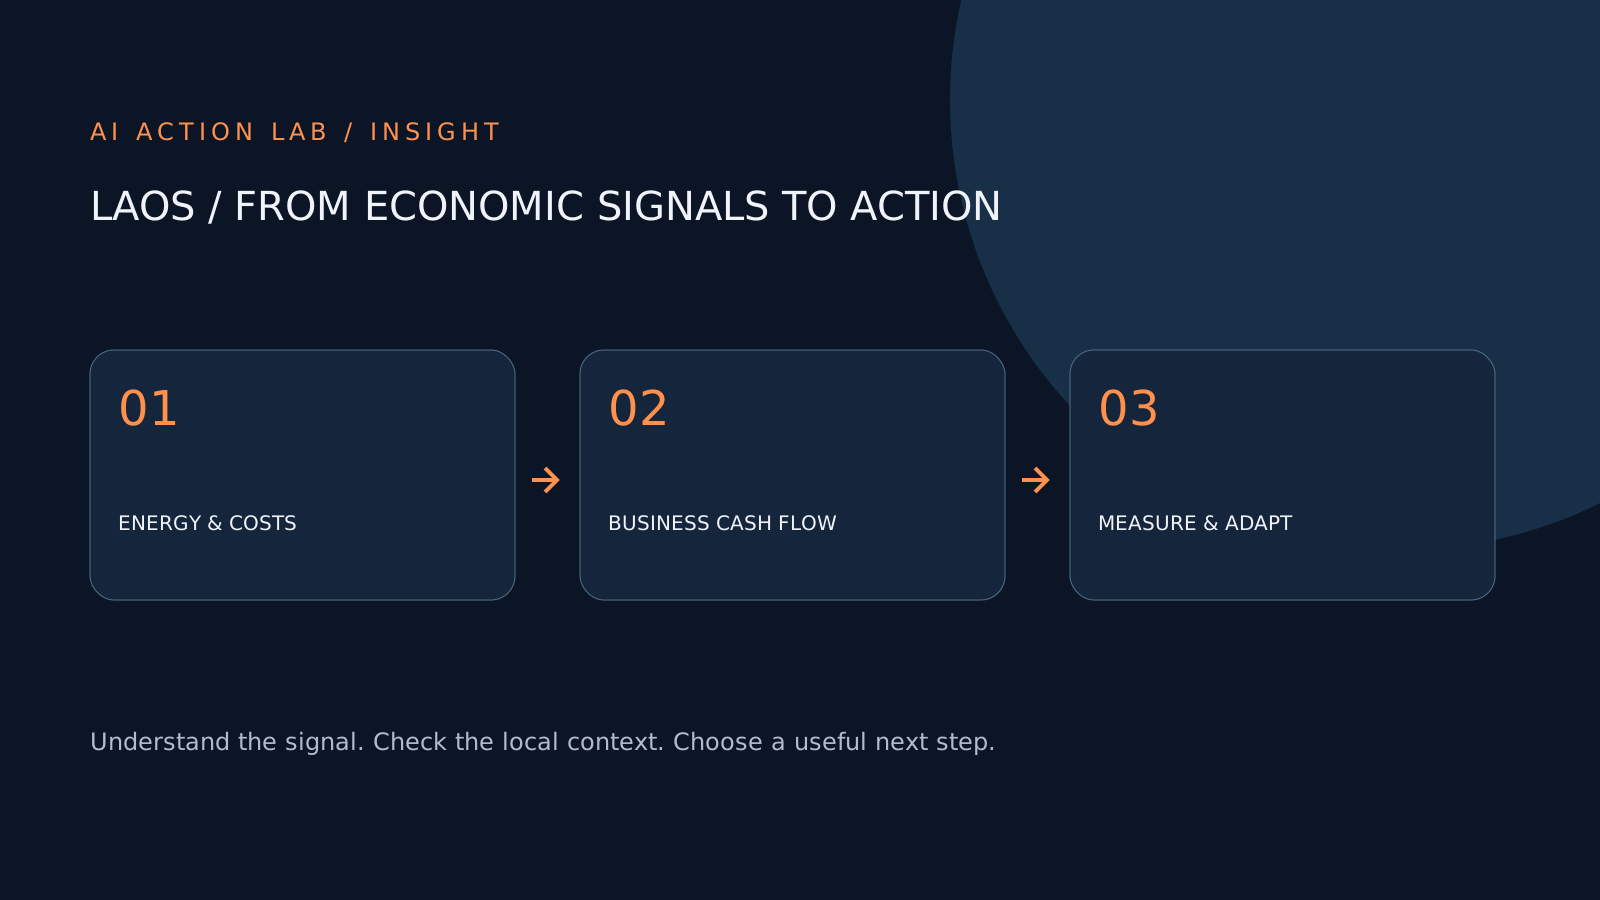
The key points
- The World Bank’s June report projects 3.8% growth in 2026.
- That figure is a forecast, not a measured final result.
- Our practical analysis: use better records to test costs before adding AI.
Read the date before the number
The World Bank release of 9 July 2026, discussing its June economic monitor, projects Lao GDP growth of 3.8% in 2026 and highlights exposure to oil-price pressure. This is a dated forecast, not breaking news on 1 October or a final annual result. Source
The report record distinguishes its June document date from July disclosure. That distinction matters when comparing forecasts: two institutions may use different dates and assumptions. Do not average their numbers and describe the result as an official forecast.
What does this mean for one shop?
AI Action Lab’s analysis: an economy-wide forecast cannot tell a shop owner whether next month will be profitable. The actionable connection is through the shop’s own inputs: purchasing, transport, stock, customer demand and cash collection. Each needs records before a tool can help.
For example, a delivery business can compare cost per completed delivery across weeks. A food business can track ingredients and packaging against quantities sold. These are proposed exercises, not claims about a particular Lao firm’s measured results.
Get curated AI news by email
Three topics per day, with a Laos perspective. Unsubscribe anytime.
Three records to establish first
First, record what was actually purchased and paid, keeping dates and units consistent. Second, distinguish sales from money collected; an unpaid order is not cash in the bank. Third, connect stock changes to the same product names used in purchasing and sales.
Review a small sample with a person who knows the business. A missing amount should remain missing until checked. Treating it as zero may make a profit calculation look better than it is. For an initial experiment, keep all names and customer details out of the sample.
Where AI can fit
AI can be tested as an assistant to explain a checked table, draft questions about unusual changes or summarize a weekly review. The calculation itself should be reproducible in the sheet or accounting system. A polished explanation is not evidence that a financial number is correct.
Ask a focused question: “Using only this checked table, identify the largest cost changes. Show the rows used and separate observations from possible causes.” If the tool invents a cause, reject that explanation and check the underlying invoices.
A useful action this week
Choose one product or route, one week and one clear metric. Complete the records, calculate the result and ask the team which change is worth testing. Measure the next comparable period before claiming improvement.
The report is background for understanding economic exposure; this article is our operational interpretation, not a forecast of an individual business or a financial investment recommendation. Better data will not remove every external risk, but it makes decisions about a business easier to check.
Get curated AI news by email
Three topics per day, with a Laos perspective. Unsubscribe anytime.